






Here is the short answer the headlines will not give you. As of September 2026, the data shows a housing market crash in exactly zero of the numbers that defined 2008, and a real price correction in several regional markets. Prices are falling in Tampa and Dallas. They are still rising nationally. Mortgage delinquency sits near record lows while it sat above 11% during the crash. Anyone who watched 2008 up close and then watched 2022 knows the difference between those two situations decides everything about your next move. This post walks through the live numbers, one by one, so you can judge the evidence yourself instead of trusting a scary thumbnail.
Key Takeaways
- The national Case-Shiller index rose 1.5% over the year through June 2026. In the 2008 bust, it fell 27.4% from peak to bottom. Those are different events.
- Price drops are real but local. Tampa is down 1.2% year over year and Dallas is down 0.7%, while Miami is up 2.3% and San Francisco is up 3.2%.
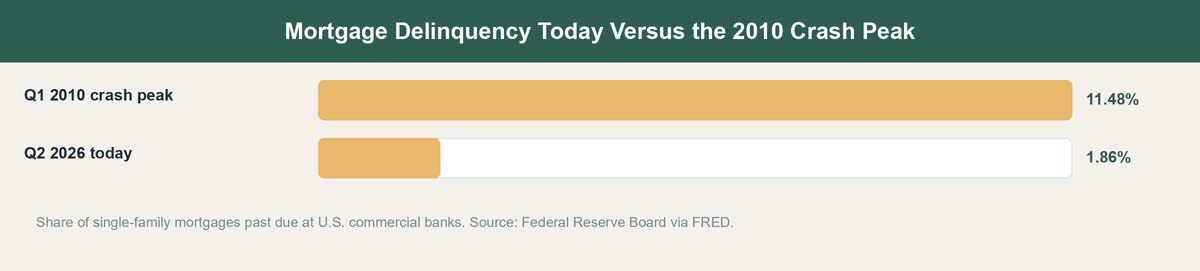
- The crash engine is missing. Mortgage delinquency at banks is 1.86%, versus a peak of 11.48% in 2010. Almost nobody is being forced to sell.
- Homeowners now own 71.9% of the value of their homes outright. At the bottom of the last bust, that equity share was 46%.
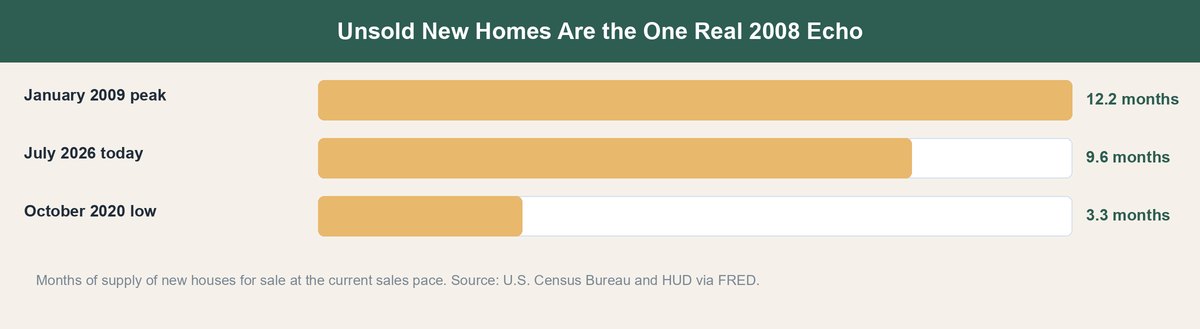
- The honest warning sign is supply. Existing homes sit at 4.9 months of supply, the highest in over ten years, and new homes sit at 9.6 months.
- Mortgage rates are rising, not falling. The 30-year rate hit 6.95% in mid-September 2026, up from 6.26% a year earlier.
What a Real Housing Market Crash Requires

A crash is not “prices went down.” A crash is forced selling at scale. That is the mechanism, and if you remember one thing from this post, make it this one.
In the mid-2000s, lenders wrote loans people could not repay. When teaser rates reset, borrowers defaulted. By early 2010, 11.48% of single-family mortgages at commercial banks were delinquent. Every foreclosure became a home the bank had to dump at any price. Millions of owners owed more than the house was worth, so they could not sell normally and could not refinance. Supply exploded while buyers vanished.
The result was the deepest home price decline in modern American history. The Case-Shiller national index fell from 184.5 in June 2006 to 134.0 in February 2012. That is a 27.4% national drop over almost six years, and hard-hit metros fell much further. Household mortgage payments ate nearly 9% of all disposable income at the 2007 peak, so families had no cushion when anything went wrong.
Why does the mechanism matter to you? Because falling demand alone produces a correction, where prices drift down a few percent while sellers wait it out. Forced supply produces a crash, where prices gap down because sellers have no choice. Different disease, different treatment, different opportunity. A housing market crash needs distressed sellers, and you should check for them before you believe any prediction.
Where Home Prices Are Actually Falling in 2026
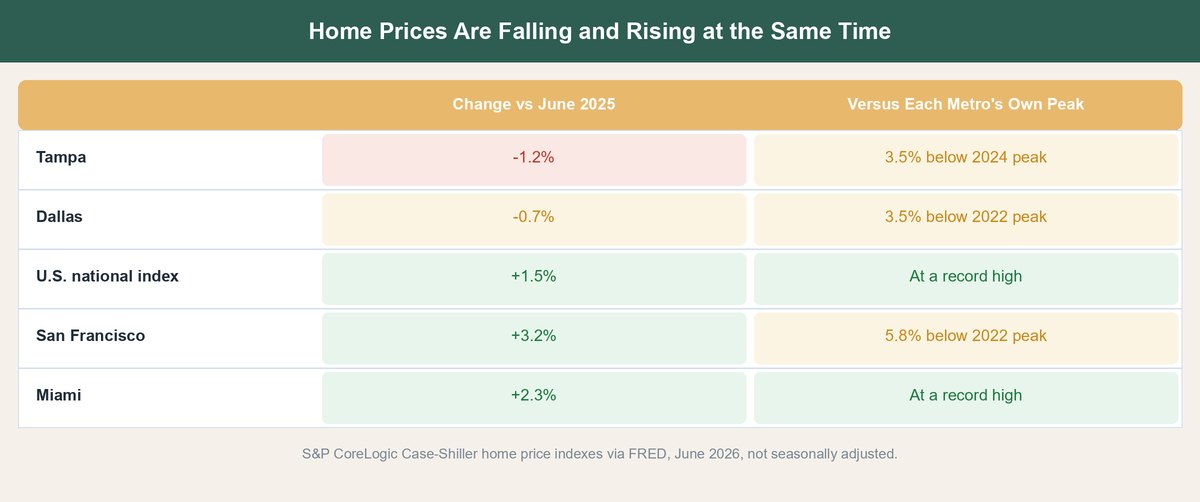
The price-drop headlines are not fake. They are just local, and the national average hides them.
Through June 2026, the Case-Shiller national index stood 1.5% higher than a year earlier. Slow growth, well under inflation, but growth. Underneath that average, the metro data splits sharply:
- Tampa is down 1.2% year over year, and sits 3.5% below its June 2024 peak. It has gone two years without a new high.
- Dallas is down 0.7% year over year and sits about 3.5% below its June 2022 peak.
- San Francisco is up 3.2% on the year, yet still sits 5.8% below its May 2022 peak.
- Miami is up 2.3% and keeps setting new highs.
So the Sun Belt boomtowns that overbuilt during the pandemic are correcting, while supply-starved coastal and lock-in markets grind higher. Both facts are true at once. That is why one video says “prices are collapsing” and another says “prices hit a record,” and neither is lying to you.
The demand side explains the softness. The National Association of Realtors reports existing-home sales running at a 3.98 million annual pace in August 2026, a deeply depressed level, with 1.62 million homes on the market. That puts months of supply at 4.9, the highest reading in more than ten years. More choice for buyers, more price cuts from tired sellers. Meanwhile Freddie Mac’s weekly survey put the 30-year fixed rate at 6.95% on September 17, 2026, up from 6.76% the prior week and 6.26% a year ago. Rising rates are pressing on demand right now, and no rate rescue is in the data.
What this means for you depends on your market, not the national mood. Pull the year-over-year price change and the months-of-supply figure for your own metro before you make any decision. A Tampa buyer and a Miami buyer are living in different markets that happen to share a state.
The Crash Dashboard That Compares 2026 With 2008
Put the crash-era extremes next to today’s readings and the picture gets clear fast. Every figure below is a live federal or industry series you can check yourself.
| Indicator | 2008-Era Extreme | Latest Reading (2026) | Verdict |
|---|---|---|---|
| National home prices (Case-Shiller) | Fell 27.4% from 2006 to 2012 | Up 1.5% year over year (June) | No crash signal |
| Mortgage delinquency at banks (FRED) | 11.48% (Q1 2010) | 1.86% (Q2 2026) | No forced selling |
| Owners’ equity share of home values (FRED) | 46.0% at the 2012 bottom | 71.9% (Q2 2026) | Huge cushion |
| Mortgage payments as share of disposable income (FRED) | 8.95% (Q4 2007) | 5.9% (Q1 2026) | Manageable burden |
| Existing-home months of supply (NAR) | Double digits in the bust years | 4.9 months (August 2026) | Loosening, near balance |
| New-home months of supply (FRED) | 12.2 months (January 2009) | 9.6 months (July 2026) | Genuinely elevated |
Read the rows and the story writes itself. The credit rows, delinquency and debt burden, are the engine of a housing market crash, and both sit near healthy levels. The equity row is the firewall. An owner with 72% equity who hits hard times sells with a profit check at closing. An underwater 2009 owner mailed the keys to the bank. Same personal crisis, opposite market outcome, which is why foreclosure waves have not returned even as the economy has wobbled.
Also notice what the dashboard does not say. It does not say prices must rise. Five of six gauges argue against a crash. None of them argues against two or three more years of flat or gently falling prices while incomes catch up. That slow-bleed outcome is what a correction looks like from inside, and it can still feel lousy if you bought at the 2022 top in a soft metro.
The Honest Warning Signs Still Worth Watching
I do not sell certainty, so here is the other side of the ledger. Three readings deserve real respect, and each comes with the threshold that would change my mind.
New Construction Supply Is the Closest Thing to a 2008 Echo
Worth knowing: at 9.6 months of supply, unsold new homes are closer to their January 2009 peak of 12.2 than to their 2020 low of 3.3. Builders are a special kind of seller. They carry loans on standing inventory, so they cut prices and buy down rates instead of waiting. In metros with heavy building, like parts of Texas and Florida, builder discounts drag down resale values next door. This is exactly where today’s real price declines live.
Rising Rates Keep Squeezing the Marginal Buyer
The math: a $400,000 loan at 6.95% costs about $2,648 a month in principal and interest, roughly $180 more than at last year’s 6.26%. Every uptick removes another slice of qualified buyers, and sales at a 3.98 million pace show it. Weak sales do not crash prices by themselves, because discouraged sellers simply de-list. But a long freeze grinds on prices in any metro where supply keeps arriving anyway.
Watch the Delinquency Line Above Everything Else
One tripwire: the single number that would move my verdict is bank mortgage delinquency pushing decisively past 4% to 5% while equity share falls. That combination would mean owners are both failing to pay and unable to exit cleanly, which is how forced supply starts. It printed 1.86% last quarter and has been near that level for years. Check it quarterly; it is free.
What Each Scenario Means for Your Next Move
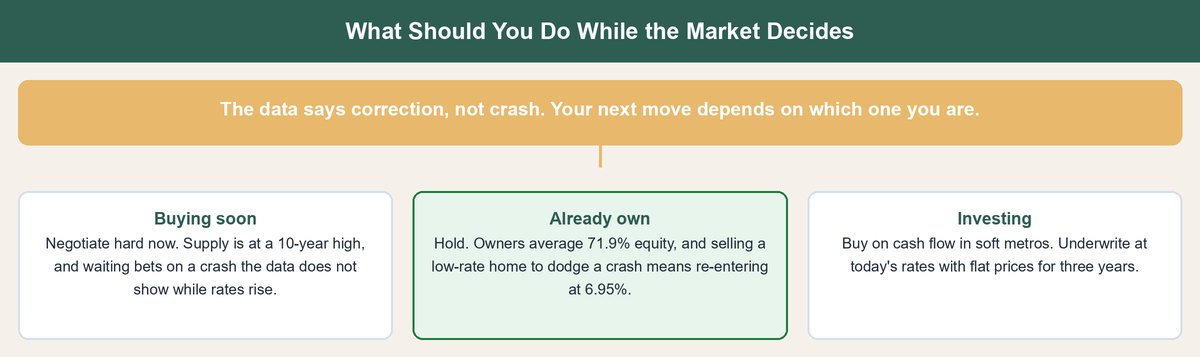
Nobody can hand you the future, so treat the two scenarios, a grinding correction or an actual crash, as a planning exercise. Here is the trade-off math for buyers, owners, and investors.
If You Are Waiting to Buy a Home
The trade-off: waiting for a housing market crash means betting on an event the delinquency and equity data say is unlikely, while rates rise against you. In the likelier correction scenario, you gain more from today’s negotiating room, 4.9 months of supply, seller credits, price cuts on stale listings, than from a hoped-for collapse. A price is permanent and a rate can be refinanced, so a fair price in a soft metro now can beat a fantasy price later. If your metro is one where prices are actually falling, patience does pay; just measure it with local months of supply, not national headlines.
If You Already Own Your Home
Your real position: with the average equity share at 71.9%, most owners can ride out a correction without acting at all. The mistake to avoid is panic-selling a home with a low fixed rate to “get ahead” of a crash the data does not show, then re-entering at 6.95%. Your bigger controllable threat is carrying costs, taxes and insurance, which keep climbing even when prices stall. We covered the insurance side in why home insurance is so expensive.
If You Invest in Rental Property
The opportunity shape: corrections reward investors who buy on cash flow, not appreciation. Soft Sun Belt metros with builder discounts and rising inventory are where sellers negotiate, and where rent coverage, not a future sale price, must justify the deal. Underwrite at today’s 6.95%-plus financing, assume flat prices for three years, and only buy what still works. If you are financing on rental income, the qualification rules are in our guide to DSCR loan requirements. Deals that need a crash-rebound story to pencil are not deals.
Frequently Asked Questions
Will the housing market crash in 2026?
The evidence says a national crash is unlikely right now, because the forced-selling engine is missing. Delinquency is 1.86% versus 11.48% in 2010, and owners hold 71.9% equity. A continued correction, flat or modestly falling prices in overbuilt metros, is the scenario the current data supports.
Are home prices dropping right now?
In some metros, yes. Through June 2026, Tampa was down 1.2% and Dallas down 0.7% year over year, while the national Case-Shiller index was up 1.5%. Both the drop headlines and the record-high headlines are true, just in different cities.
How far did prices fall in the 2008 crash?
The Case-Shiller national index fell 27.4% from its June 2006 peak to its February 2012 bottom. Hard-hit metros fell far more than the national average, and the decline took almost six years to play out.
What would actually cause a housing market crash?
Forced selling at scale. That takes a wave of defaults, delinquency climbing toward 5% and beyond, plus owners with too little equity to sell normally. Job losses alone do not do it when owners can exit with a profit instead of a foreclosure.
Should I wait for a crash before buying a house?
That is a bet, not a plan, and it carries a cost: rates rose from 6.26% to 6.95% over the past year, about $180 a month on a $400,000 loan. A sounder approach is to negotiate hard in today’s high-supply market and buy only what you can afford at current rates.
Is it a bad time to sell a house?
It is a slower time, not a bad one. With supply at a ten-year high, correctly priced homes still sell, but overpriced listings sit and then take cuts. If you hold a low-rate mortgage and do not need to move, holding is often the stronger position.
The Bottom Line Before You Act on a Headline
The crash question has a checkable answer, and today that answer is: correction in parts of the market, crash in none of the data. Rates at 6.95% and ten-year-high supply are reshaping who has leverage, and that is the real story worth your attention this fall. For where things could head next year, our housing market predictions for 2026 covers the forecast side of this question.
This article is educational, not financial, legal, or tax advice. Markets shift and your situation is specific, so run any purchase, sale, or refinance decision past a licensed professional in your state. If you found the dashboard useful, bookmark the source links and re-run the numbers yourself each quarter. The data is free, and it is calmer than the headlines.
Photos: Neal E. Johnson and Bruno Guerrero on Unsplash.